Group Analytics: Group users together as an aggregated unit of measurement
Customers on an Enterprise or Growth plan can access Group Analytics as an add-on package. See our pricing page for more details.
Overview
Mixpanel Group Analytics allows behavioral data analysis at a customized group level (such as account, device—or any other way you want to assess your business). This enables the power to analyze, as an example, whether a company or team completed a funnel instead, allowing multiple users in the company/team to perform various stages of the process, rather than requiring for a single user to complete the entire workflow to count as a conversion.
Data Modeling
Mixpanel Group Analysis allows you to select alternative unique identifiers in reports.
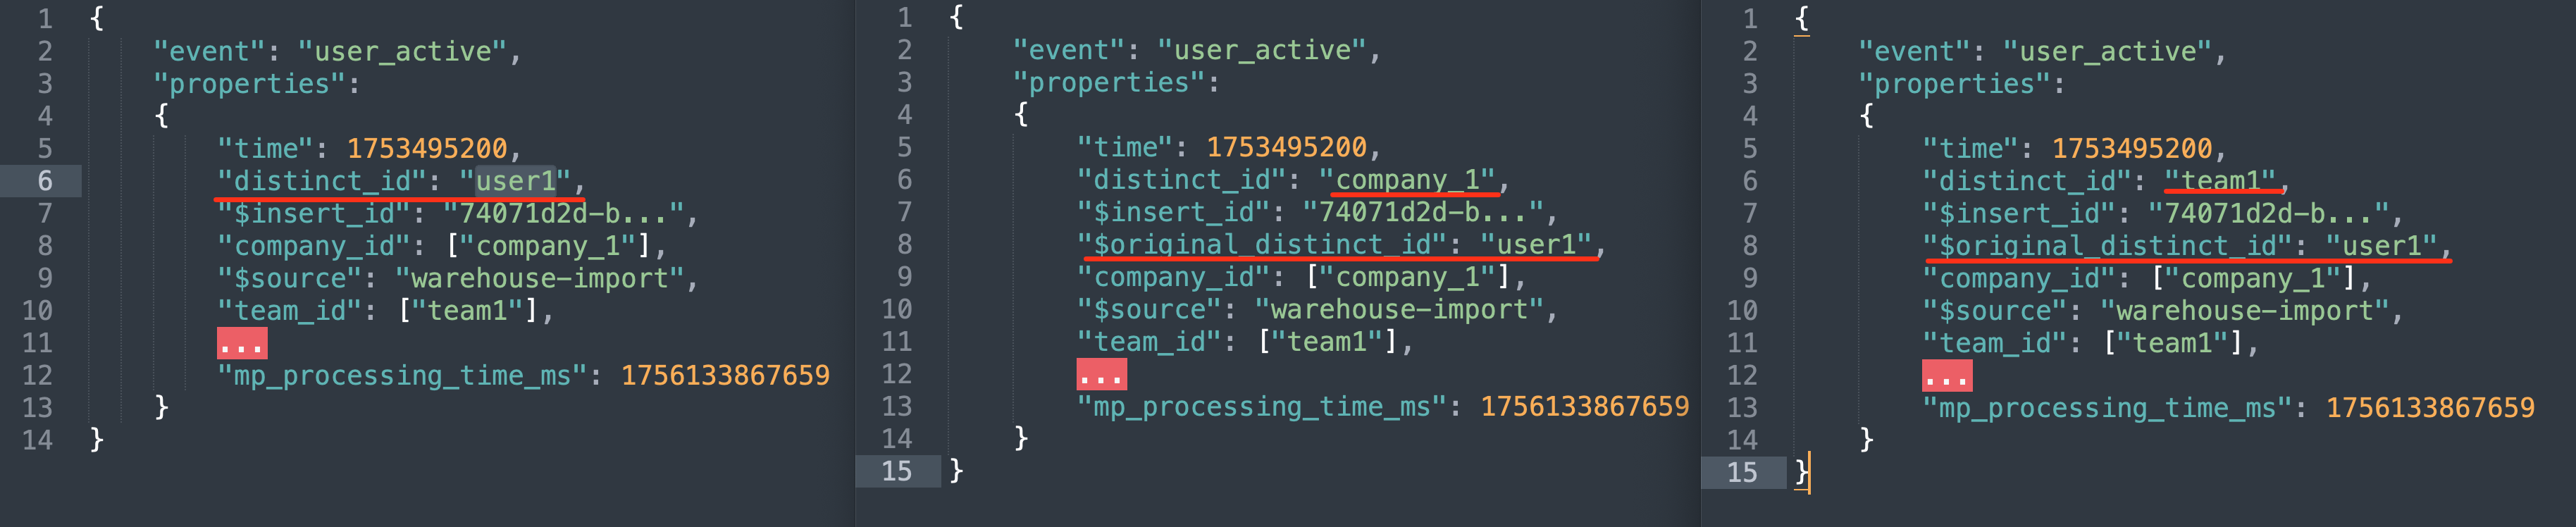
By default, Mixpanel counts unique users by distinct_id. Group Analytics allows you to uniquely count events by an alternative identifier, such as company ID, invite ID, or another value shared by a group of individuals with different distinct_ids. Below you will see an example of an event coming into a project that has company_id and team_id set up as separate group keys. You will see how, starting with a single event being ingested (on the left), by switching the identifier you’re analyzing on, the event can be read with said identifier as the user key to do the analysis on:
This allows behavioral analysis from a business or group level, as opposed to an individual level. You can answer questions such as:
- Which companies are engaging the most with a product?
- In instances where there are more than one user per account, such as a video streaming service, how are events triggered at an account level?
- What groups convert through a funnel to a goal event (as opposed to what individual users convert)?
Group Profiles
Much like a user profile, Group Profiles are a collection of properties and event history specific to a group.
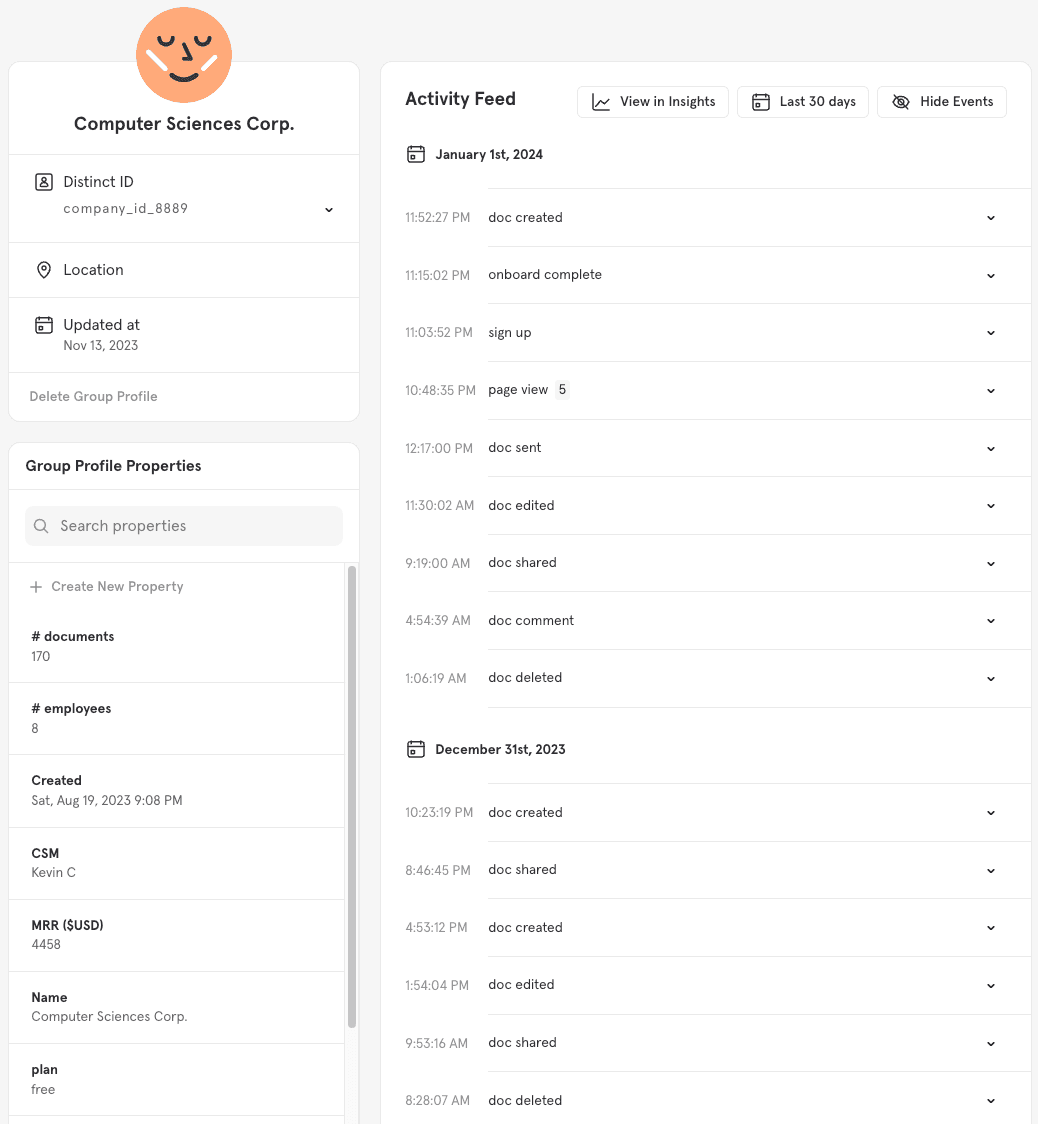
Group Profiles have an activity feed that shows the events performed by users in a group. Only the events attributed to the group with a defined group key will appear in the group’s activity feed.
The Group Profile also displays the properties unique to that group - here’s an example of it:
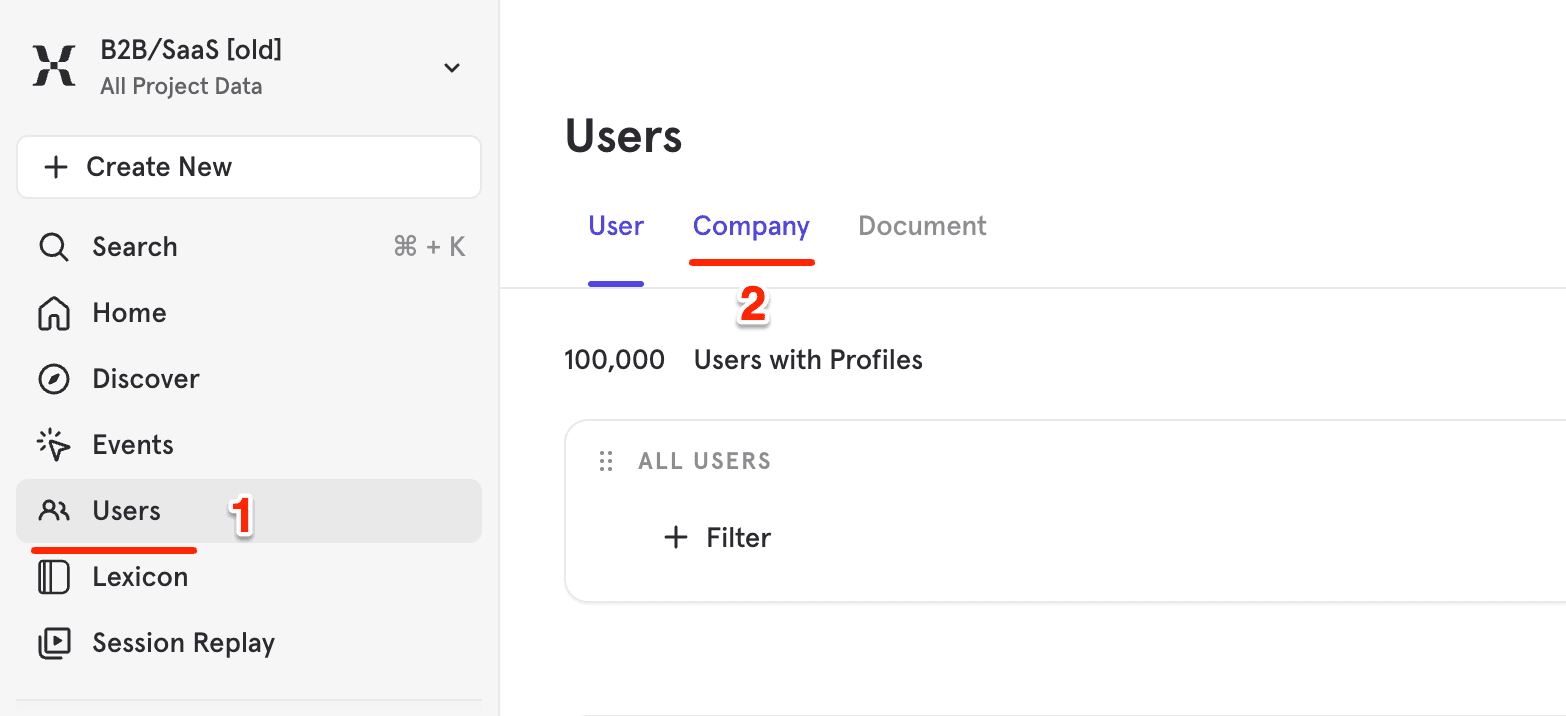
To access a group profile:
-
Navigate to the Users page from the menu.
-
Click on the group identifier you want to analyze on.
- Groups profiles will populate the Users report.
Change the Group Identifier in a Report
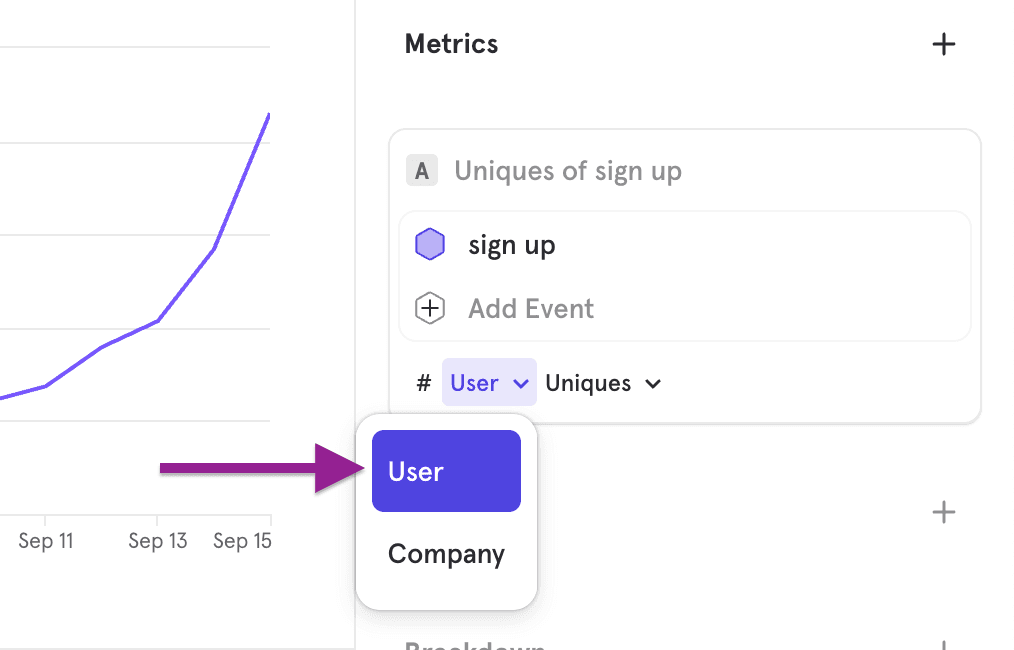
By default, Metrics aggregates at the user-level. To change the identifier used for aggregation in a metric:
- Go to a report
- Click the “Users” dropdown within the Metric
- Select a Group. The report will now display results grouped by the newly selected group identifier.
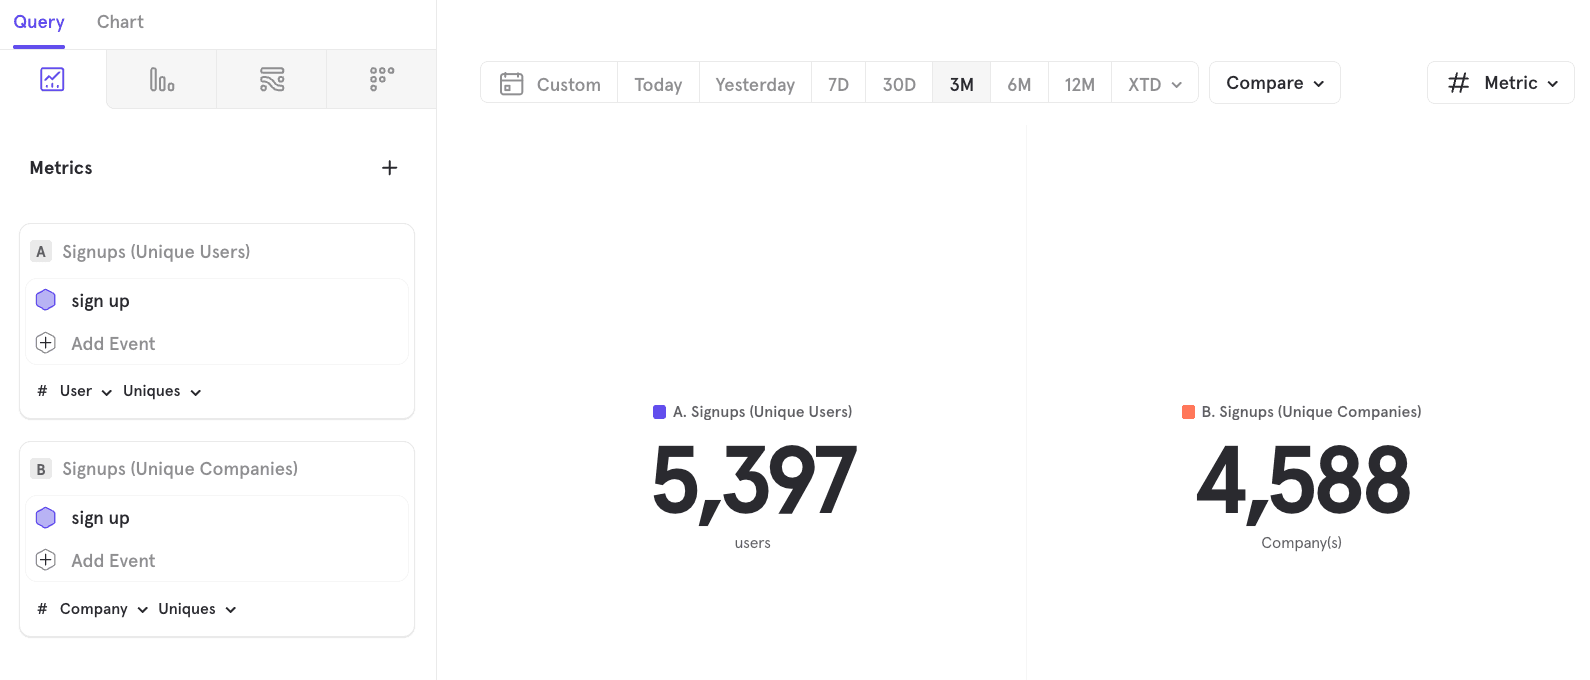
When your Insights report includes multiple Metrics, you can individually toggle the identifier for each one.
For example, you can create an Insights report that shows Signups by unique Users and by unique Companies.
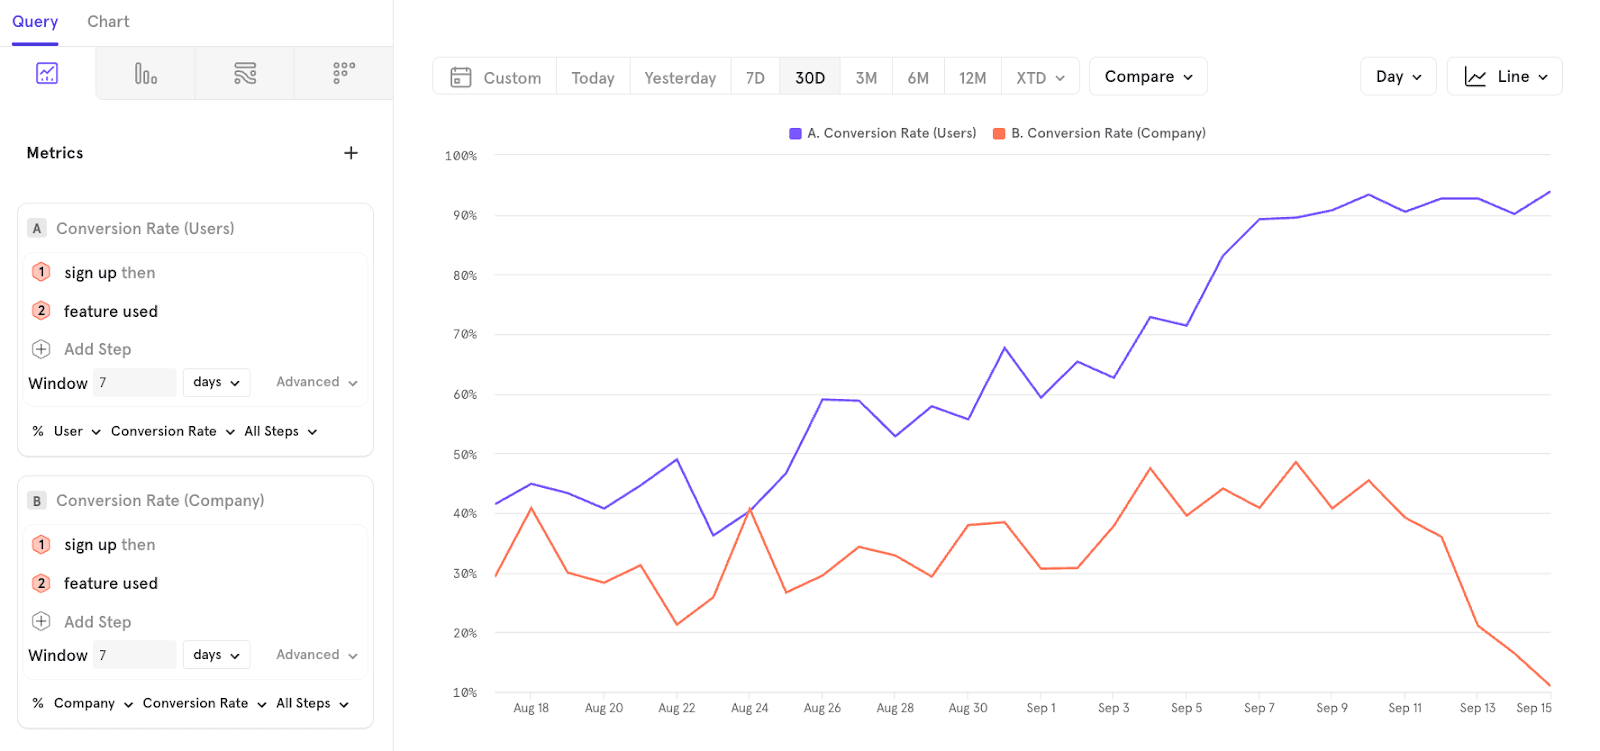
Similarly, you can build a report that displays Conversion Rates per User and per Company.
B2B Company Analytics
Company Analytics is a feature within Group Analytics tailored to B2B SaaS Companies. Here we focus on the idea that users ‘belong’ to a company, and that company behavior is dependent on user behavioral activity. For instance, if you have 2 accounts, each worth $50M but with 5 and 20 users respectively, the account with 20 users is considered more healthy and likely to renew compared to the other account.
Company Analytics enables you to understand such account health and activation metrics, which are derived from the underlying user activity.
To use these features, you must designate the group key as a company key when setting up the group.
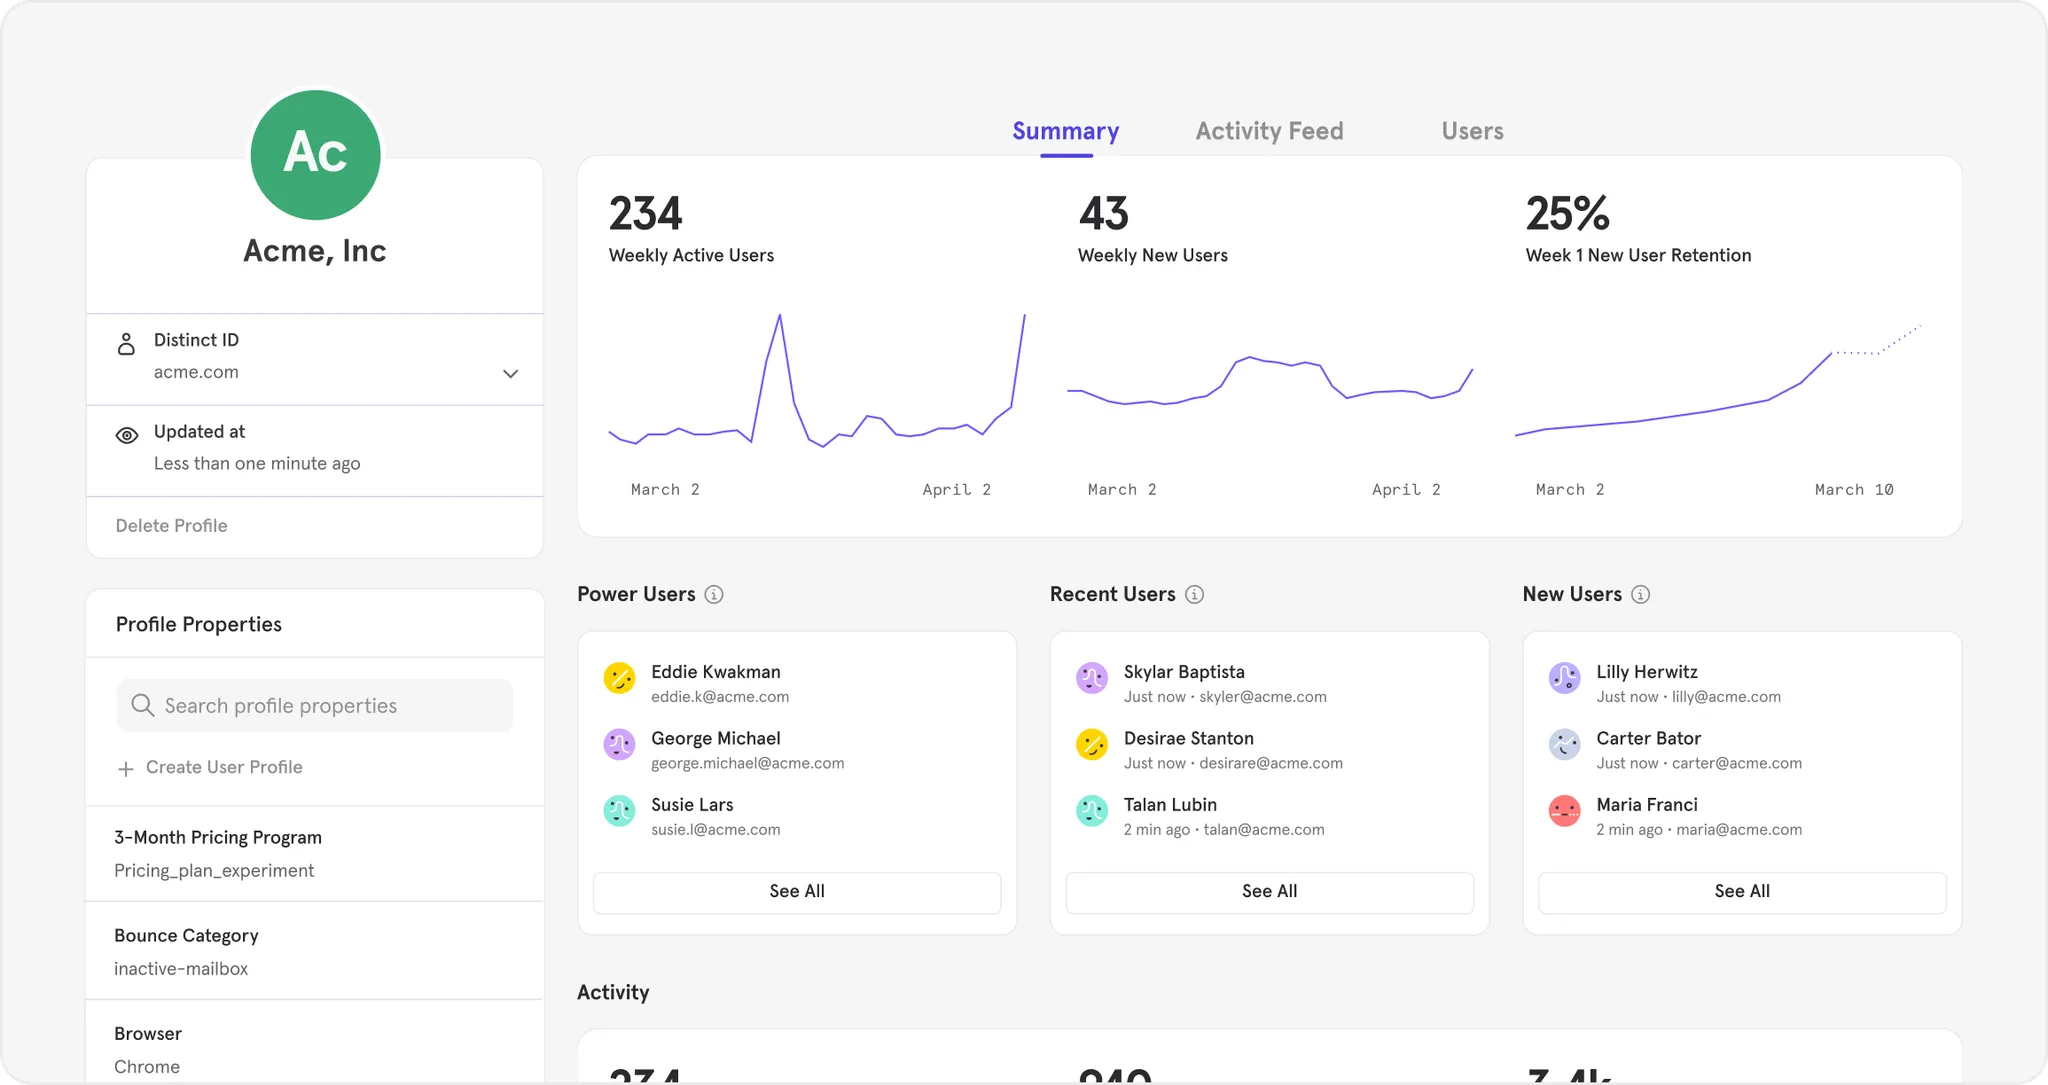
Company Profiles
The Company Profiles page gives you a holistic view into your company health, which includes key metrics and company profile properties (i.e, company attributes).
Company Health Metrics on the page include KPIs on usage (DAU, WAU, MAU, new users), users’ engagement level (activity per user, life cycle of user), and their retention (Day 1, Week 1, and Month 1).
You can view the definition of each metric by clicking on the metric card, which will open the underlying Mixpanel report.
To access this page, click on Users/ Companies → Company Profile.
Note: This is only available if you have set up a B2B Company Key, an option available in the Group Analytics package.
Activation Metrics
SaaS companies often have use cases that require them to segment companies based on the number of users and the quality of users.
For example, a question you may have is ‘What is the number of trial accounts that have more than two active users?’. The hypothesis is that these accounts will convert faster.
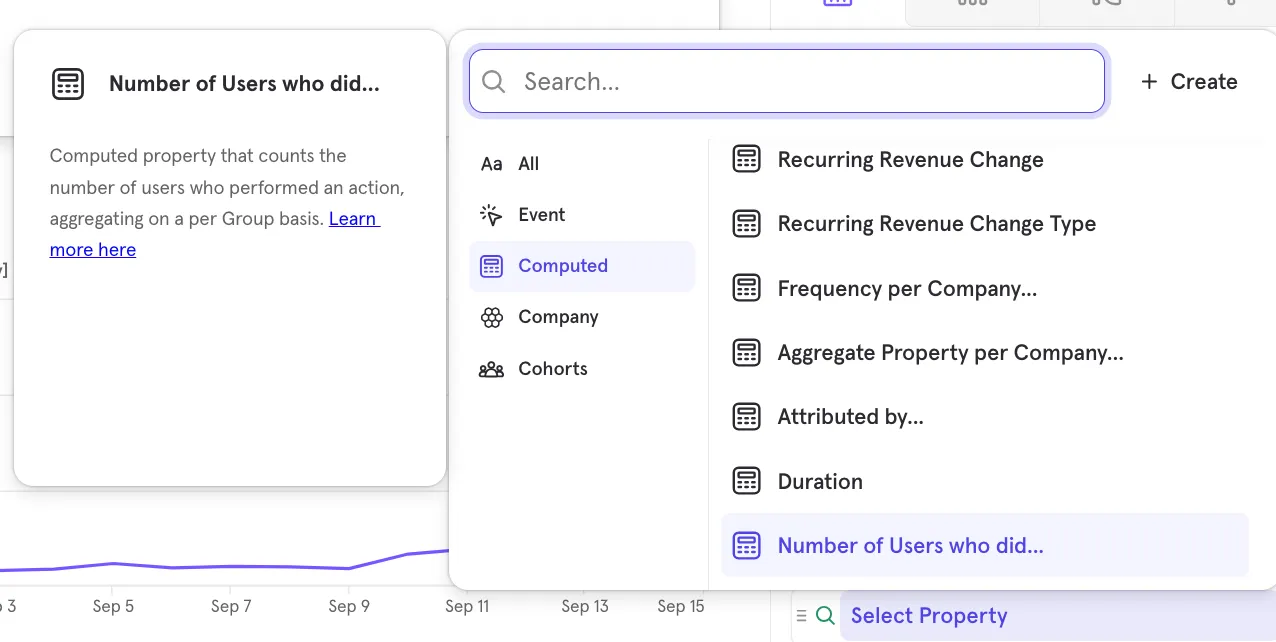
We have a computed property in both breakdown and filter, called the “Number of users who did…”, available in the Group Analytics add-on, which enables you to answer these types of questions as it allows you to break down account activity by the number of active users.
When using “Number of users who did…” as a breakdown, we show you how many downloads came from different types of account health. For example, 605 downloads came from accounts with zero active users. ~1.5 downloads in the last 30 days came from accounts with two active users. Where an “active user” is defined by both the activity (e.g., event as such document created) and frequency of the activity (e.g., performing the event ≥1 time).
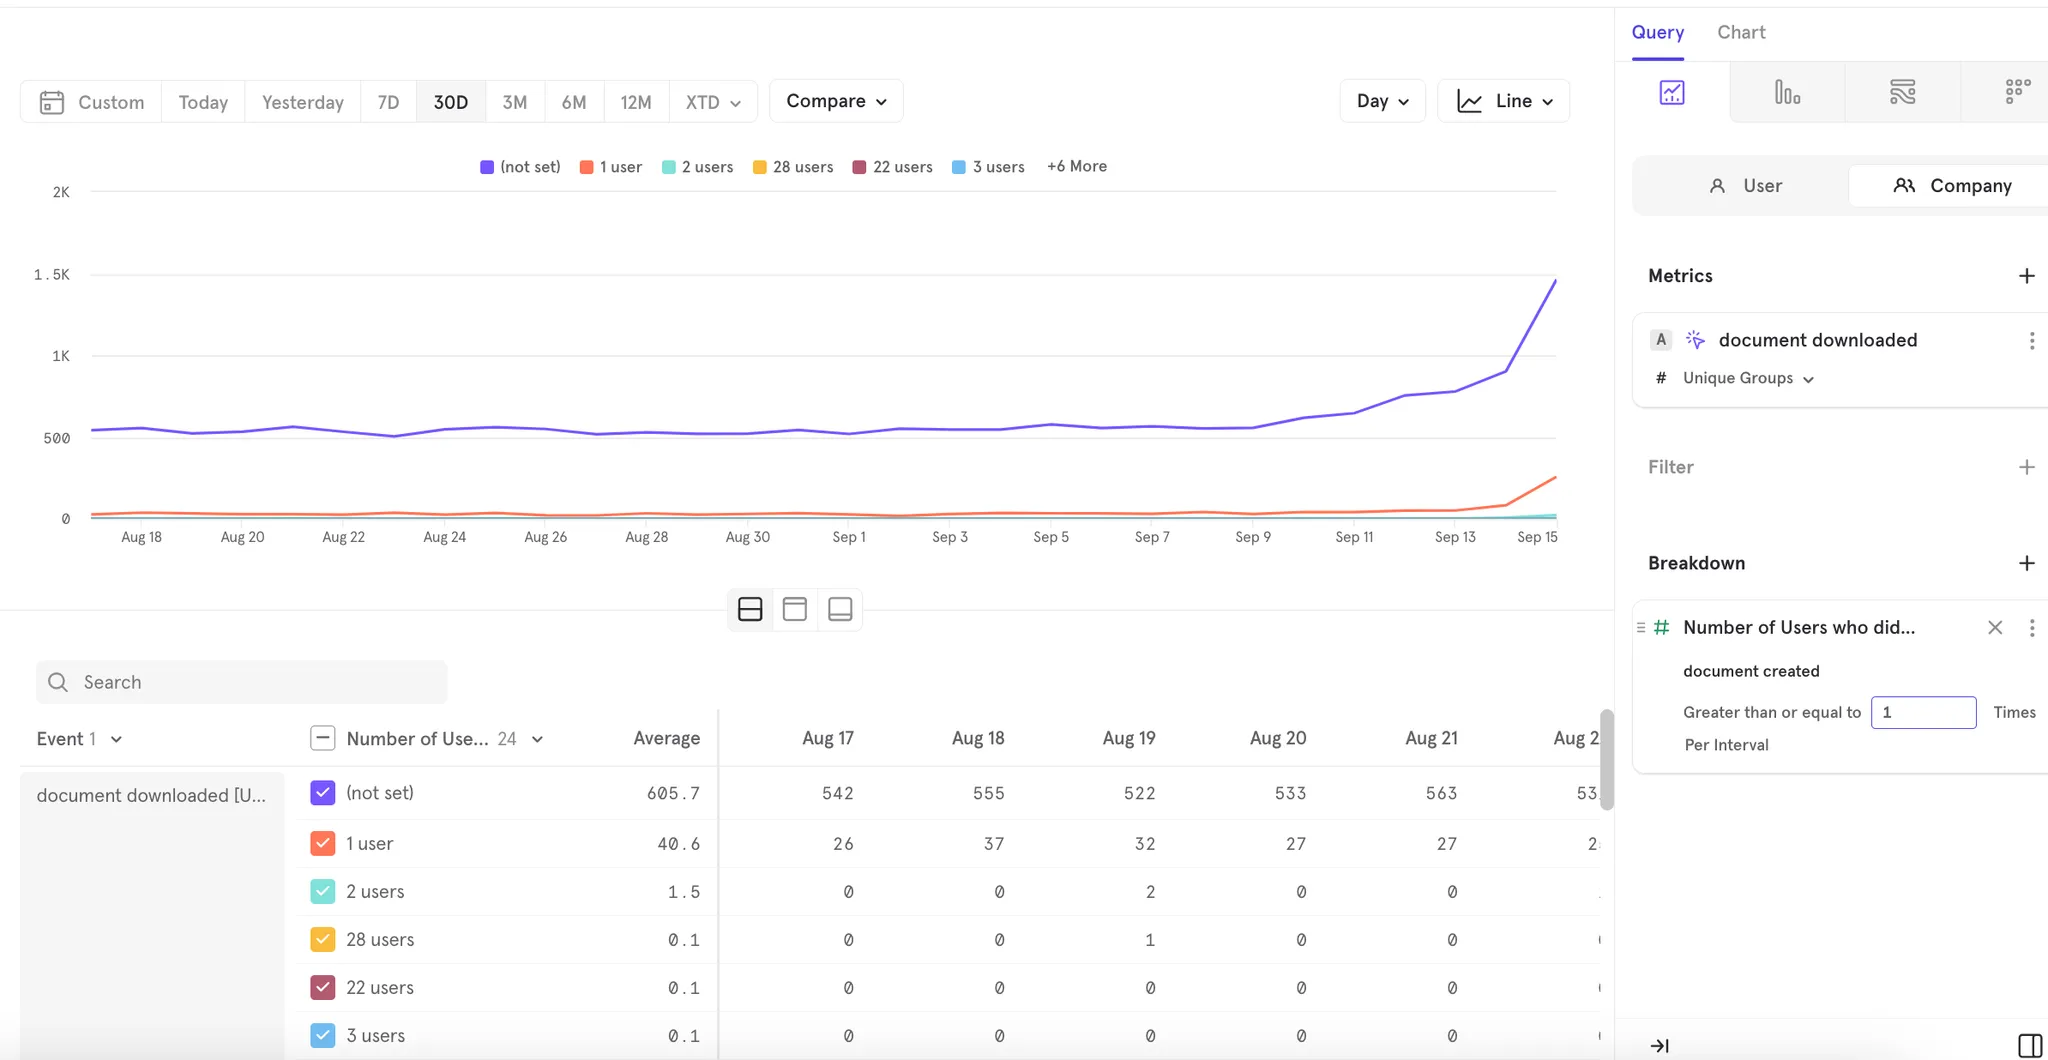
In a line chart, we look for activity per interval.
For example, in the below daily chart, we’re looking for activity qualification per day (i.e., an active user is one who has created at least one document on that day). The chart below shows that on Aug 19th, 35 accounts downloaded a document. Of the 35 accounts, 32 had one active user, 2 had two active users, and 1 had twenty-eight active users. Since most downloads originated from accounts with only one active user, we can conclude there is no correlation between account document downloaded activity and account health.
Was this page useful?